MYCRMS
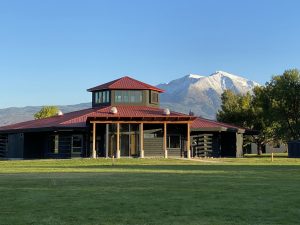


 Virtual Tour
New Course Spotlight: Social Justice Statistics
In statistics, means can be misleading. One number, one radical outlier, can dramatically skew the calculation of an average and thus skew the conclusions we draw from data that over-emphasizes averages. However, understanding how misleading averages can be is considerably more compelling when accompanied by an example, particularly when that example is taken directly from the world in which we live.
Take a look at recent data from the National Assessment of Educational Progress reflecting the declines in student achievement following the Covid-19 pandemic. According to The New York Times’s morning newsletter, “while the overall declines in student achievement were stark, the averages mask even deeper divergences between student groups.” More specifically, “in fourth grade, the average reading score on the national exam fell three points. But results for students in the top 90th percentile did not fall at all, while those for students in the bottom 10th percentile plunged six points, double the overall average.”
By understanding the numbers behind these “averages,” we begin to more fully comprehend the landscape of student achievement gaps, a landscape further complicated by rates of poverty, disparities in remote learning duration, etc. Analyzing this data is an essential piece of beginning to look for solutions that will make society more functional, more equitable, and more sustainable.
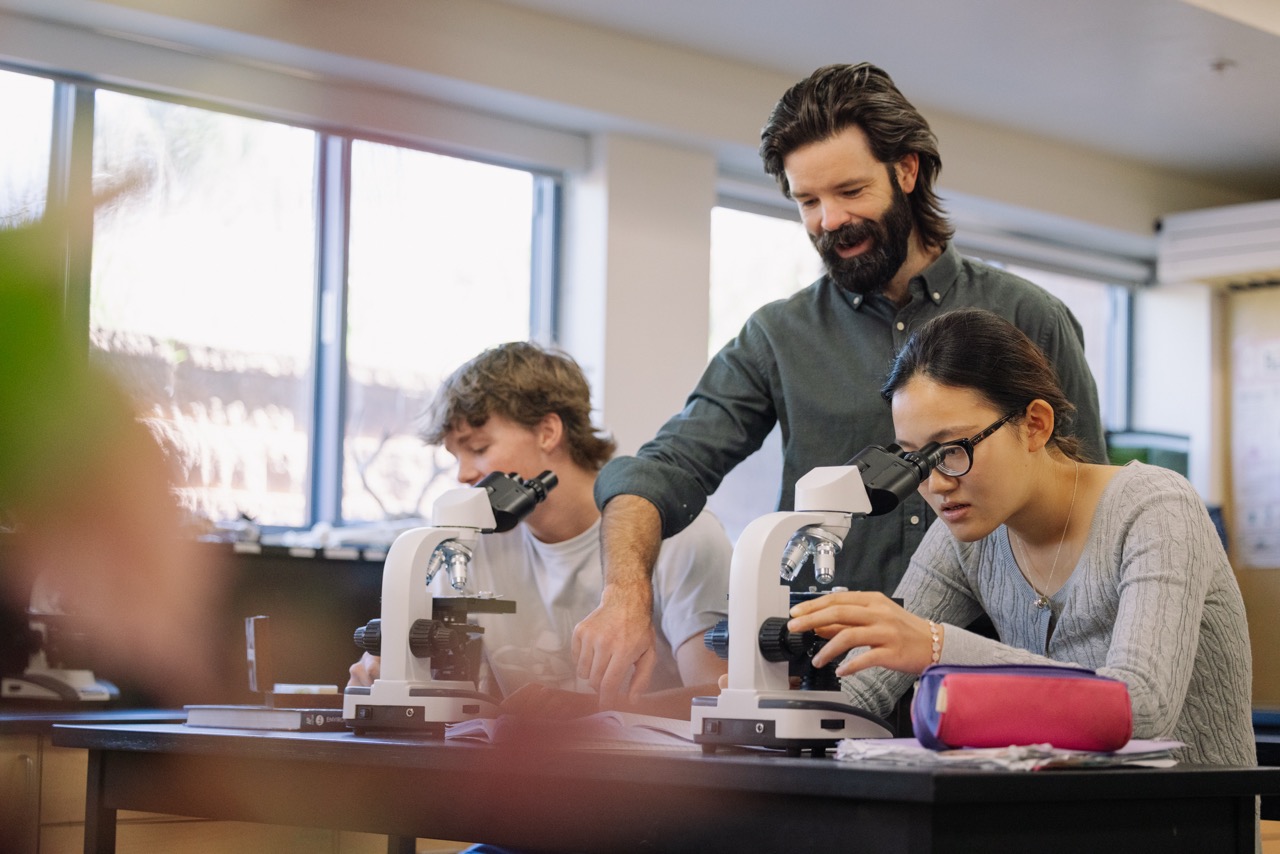
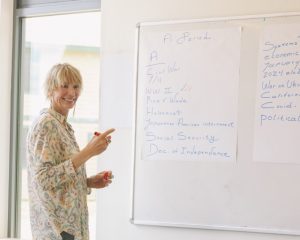
The conventional trajectory for high school math curricula moves from Algebra and Geometry to Pre-Calculus and then to Calculus. However, some students pursue an alternative to Calculus. As of this year, CRMS students who have chosen to pursue higher-level math have the option to take a class called Social Justice Statistics, which pairs math skills with contemporary issues of equity and justice.
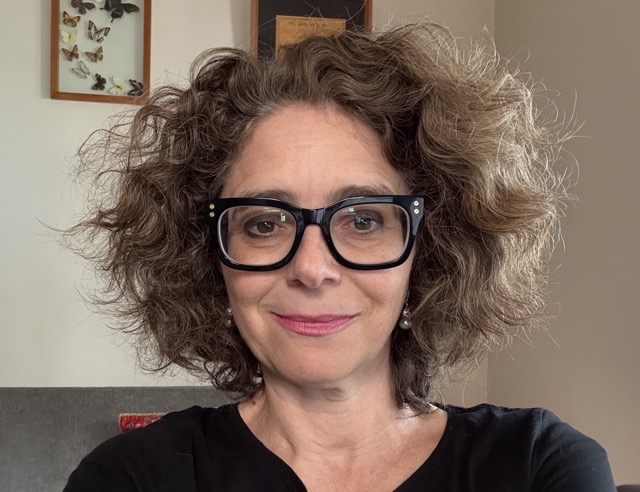
Jarin Rice, the teacher at the helm of Social Justice Statistics, explains that his goal is “to expose students to traditional statistics topics with applications of those concepts to social justice issues like race, gender, and class.”
Students are energized and engaged by the relevance and importance of the material. No longer will they be calculating how far two trains must travel to a common destination when one is speeding at 95 miles per hour, and the other is creeping along at 12 miles per hour… Rather than solving seemingly arbitrary math problems, Jarin’s Social Justice Statistics students apply their knowledge of standard deviation, for example, to contemporary data on the racial and socio-economic demographics of Florida prison guards and prisoners. Jarin based this particular application of standard deviation on the first chapter of Eyal Press’s book, Dirty Work: Essential Jobs and the Hidden Toll of Inequality. Press’s first chapter is an exposé of the shortcomings and failures of the mental health care support of prisoners at the Dade Correctional Institution in Florida.
In addition to the class’s open-source online textbook, Introductory Statistics, Jarin’s students are reading Press’s book this fall as a complement to their mathematical studies. Published in August of 2021, Dirty Work offers an in-depth look at “the work society considers essential but morally compromised” at a time when the Covid-19 pandemic illuminated the necessity of essential workers while also underscoring the health and safety risks those workers face. According to the publisher, Press “reveals fundamental truths about the moral dimensions of work and the hidden costs of inequality in America.”
Jarin is keen for students to think deeply about the social structures that disadvantage certain demographics more than others. After each chapter in Dirty Work, Jarin poses a discussion question and asks students to either write a response for the class to consider or to record a two-minute video journal in which students can share their ideas and reactions verbally.
After completing a unit from the statistics textbook, Jarin links the hard math skills to a real-world problem. In a recent unit, Jarin asked students to analyze the effectiveness of prenatal testing for certain chromosomal disorders using their understanding of probability statistics. After completing their standard deviation unit, the students researched regional, racial, and socio-economic differences between public school districts in the U.S., with Jarin prompting analysis through questions like, “what do you notice as you compare the data for each demographic category?” Jarin urged his students to look for predictive factors that might indicate whether a school district would fall into either an above-grade-level, at-grade-level, or below-grade-level category in order to investigate inequities for people of color and economically disadvantaged populations.
Sadie Shoemaker, a CRMS junior taking Social Justice Statistics, has found the class’s insights to be profound. She explains, “before taking this class, I would be a part of conversations about social justice issues. For example, [conversations about] police brutality toward people of color versus white people. I knew that there was a disparity, but I didn’t really realize how when you look at the statistics, you see how extreme it is.” Sadie says that she’s most familiar with the instances of police brutality that have caught national attention, each one deeply troubling and unjust on its own. But when she encountered a full statistical accounting of the sheer volume of instances, she realized how people of color are drastically more likely to be victims of police brutality.
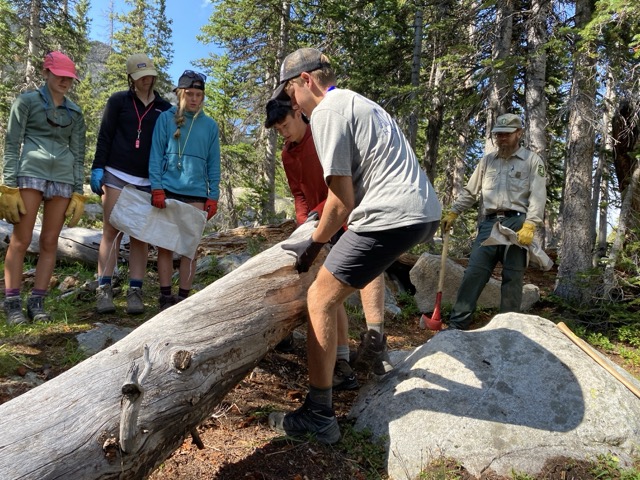
Social Justice Statistics prompts students to think critically about the social structures that contribute to statistical inequities. Jarin asks his students to apply their math skills to tangible and pertinent social issues. This inextricable link between math skills and real-world issues fits within the framework of education so ardently implemented by John and Anne Holden, the CRMS ethos of real-world problem-solving. When a student on Ranch Crew digs a post-hole, an actual fence post will be placed in the hole in order to contain actual cows. When a student orients a map and compass during their Wilderness Orientation trip, they will be finding an actual route through the mountains. When a student builds a bike during Interim, they will use that bike to cruise from their dorm to their classes. The students of Social Justice Statistics will use their skills to better understand social disparities, and hopefully, these students will be all the more equipped to tackle issues of social injustice in their futures.
To learn more about our other course offerings, visit our website’s Academic section.